
Using the Relative Strength Index (RSI) Indicator in Trading
The Relative Strength Index, or RSI, was developed by J. Welles Wilder with the purpose of assessing the relative strength of the market at any given time. Utilizing this tool can help you gauge the strength of market moves and whether the prevailing trend is likely to continue or is possibly a false signal that can be disregarded.
Interpreting the Relative Strength Index (RSI) Indicator
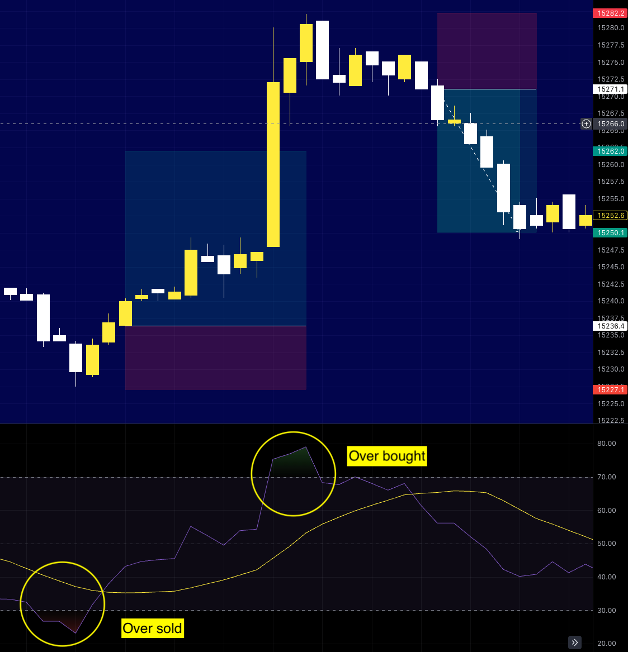
The RSI shares similarities with the Stochastic indicator in terms of its user-friendliness. You simply look for the indicator to cross certain key levels. The RSI’s range is from 0 to 100, but your focus is primarily on its crossing above 70 or below 30. When the RSI crosses above 70, it suggests that the market may be overbought, signaling a potential selling opportunity or at least a cautionary note against further buying.
On the contrary, when the RSI drops below 30, it indicates an oversold market, suggesting a possible buying opportunity or at least a consideration to unwind a sell position. Additionally, an RSI crossing below 50 and moving downward suggests a bearish trend until it reaches 30. Conversely, an RSI crossing above 50 and heading upward implies a bullish trend until it hits 70. These are the types of RSI movements to watch for when interpreting the indicator’s data.
Confirming Trend Formation
Rather than solely relying on the RSI to identify the end of a trend, it’s more beneficial to use it as a tool to confirm a trend you believe is forming. When you spot a potential trend, check if the RSI aligns with your observation. If it does, it provides an additional layer of confirmation for your analysis, and you can consider joining the trend for potential profits. However, if the RSI doesn’t support your analysis, it may be prudent to wait for a more favorable opportunity.
It’s important to note that the RSI should not be your sole decision-making factor in trading. Placing excessive reliance on a single indicator is risky. Instead, use the RSI as a supplementary tool to validate your assumptions about trends and then incorporate other factors into your trading strategy. By doing so, you can make more informed trading decisions in the market.


