
Understanding candlestick patterns is a critical aspect of your journey in forex trading. It plays a significant role in your ability to analyze the market and achieve long-term success. But before delving into patterns, let’s take a moment to understand what a candlestick represents in forex trading.
Defining a Candlestick in Forex Trading
In trading, a candlestick serves as a visual representation of price movements within a specific time frame. Each candlestick provides four essential pieces of information: the opening price, closing price, highest price, and lowest price.
Patterns formed by multiple candlesticks help identify price trends, assisting forex traders in making decisions about when to buy and sell currencies. In the context of forex trading, candlesticks illustrate fluctuations in the exchange rate of a currency pair over past and present periods.
The Historical Roots of Candlesticks
The origin of candlestick analysis can be traced back to Munehisa Homma, an 18th-century Japanese rice trader. Homma’s use of candlesticks aided in analyzing rice price movements and forecasting future prices for rice futures contracts. The credit for introducing candlestick patterns to Western financial markets goes to Steve Nison, who authored the book “Japanese Candlestick Charting Techniques” in 1991. Since then, these patterns have gained widespread popularity among traders globally.
Key Components of a Candlestick
A standard candlestick typically comprises the following components:
Real Body: The real body represents the price range between the opening and closing prices during a specific time period. It includes:
Opening Price: The initial price at the start of a trading session.
Closing Price: The final price that marks the end of the trading session.
Shadows: Shadows signify the highest and lowest prices within the trading session. They consist of:
Upper Shadow: The peak indicating the highest price during the session.
Lower Shadow: The bottom signifying the lowest price recorded in the session.
Additionally, Japanese candlesticks are color-coded, typically appearing in two colors: green and red. Each color carries a distinct meaning:
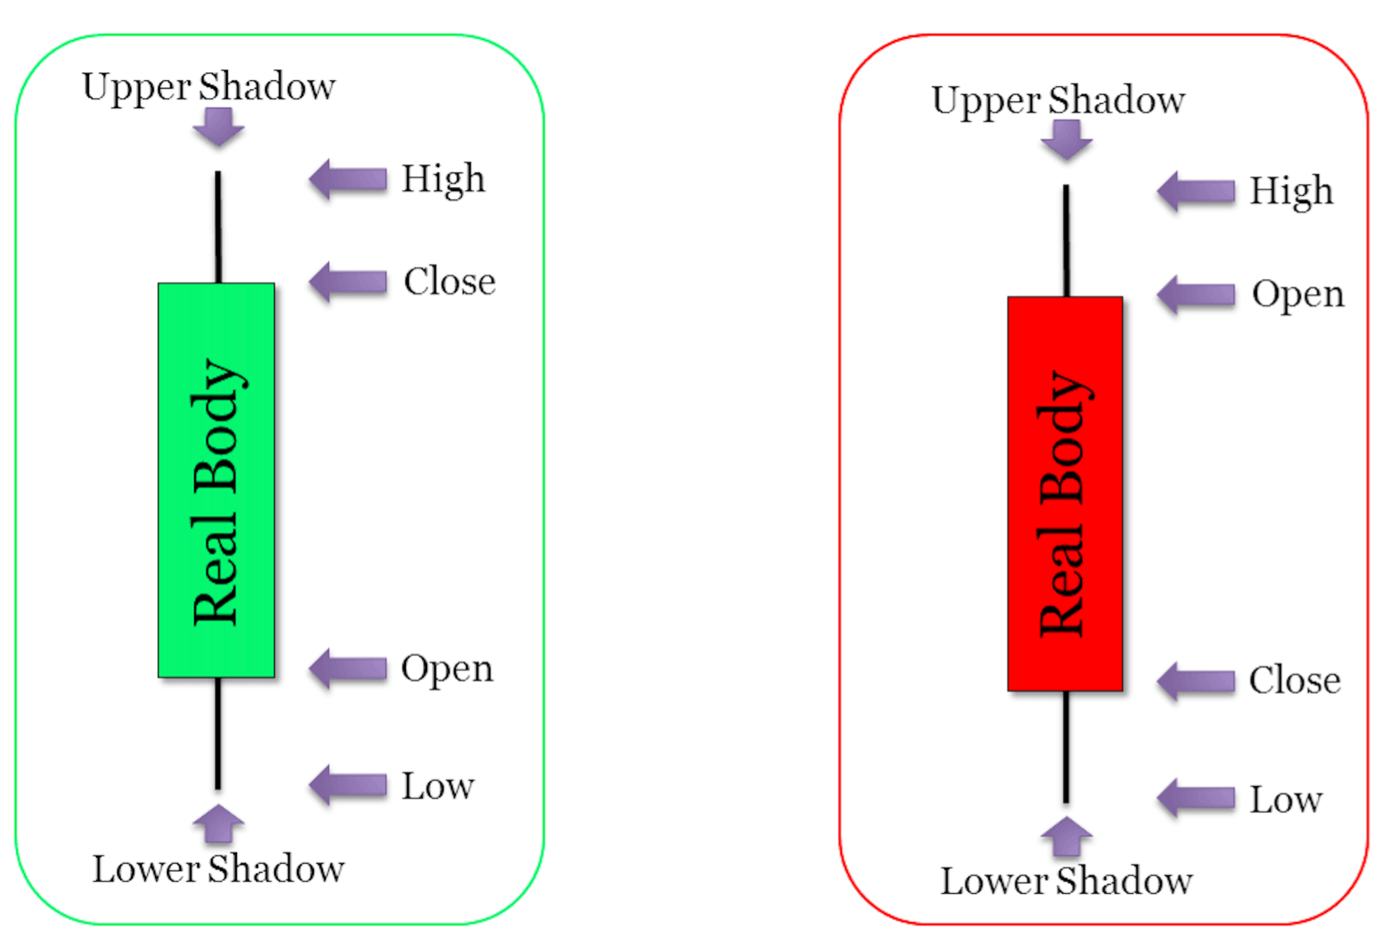
Green Candlestick (Bullish Candlestick): This occurs when the opening price is lower than the closing price, indicating a price increase.
Red Candlestick (Bearish Candlestick): This forms when the opening price is higher than the closing price, signaling a price decrease.


